DashForge MCP / AI Control
DashForge includes a local MCP-style API server for trusted AI tools. It can inspect live telemetry, read live analysis results, and run a small set of controlled app commands.
The MCP server is independent from the Web Builder.
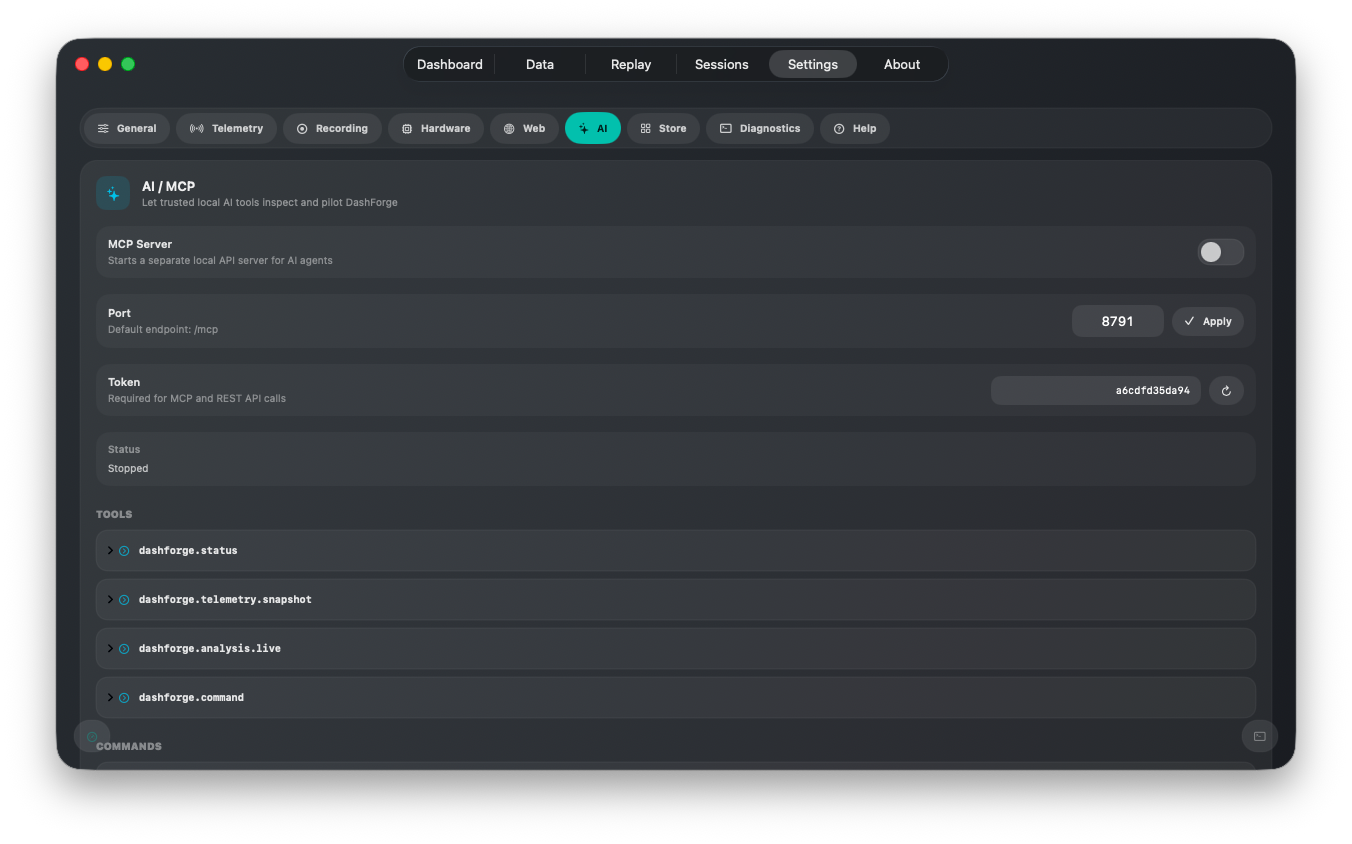
Enable the Server
- Open DashForge.
- Go to
Settings > AI. - Enable
MCP Server. - Keep the default port
8791, or choose another free port. - Copy the MCP token.
Default endpoint:
http://localhost:8791/mcp
Accepted auth headers:
X-DashForge-MCP-Token: YOUR_TOKEN
Authorization: Bearer YOUR_TOKEN
REST Endpoints
GET  /api/status
GET  /api/tools
POST /api/command
POST /mcp
/mcp uses JSON-RPC 2.0 with tools/list and tools/call.
LM Studio Config
If LM Studio supports HTTP MCP servers:
{
  "mcpServers": {
    "dashforge": {
      "url": "http://localhost:8791/mcp",
      "headers": {
        "X-DashForge-MCP-Token": "YOUR_TOKEN"
      }
    }
  }
}
If your LM Studio setup expects stdio MCP only, use an HTTP-to-stdio bridge:
{
  "mcpServers": {
    "dashforge": {
      "command": "npx",
      "args": [
        "-y",
        "mcp-remote",
        "http://localhost:8791/mcp",
        "--header",
        "Authorization: Bearer ${DASHFORGE_MCP_TOKEN}"
      ],
      "env": {
        "DASHFORGE_MCP_TOKEN": "YOUR_TOKEN"
      }
    }
  }
}
Tools
dashforge.status
Returns MCP status, current telemetry, and compact live analysis.
{
  "name": "dashforge.status",
  "arguments": {}
}
dashforge.telemetry.snapshot
Returns the normalized live telemetry model used by dashboards.
{
  "name": "dashforge.telemetry.snapshot",
  "arguments": {}
}
dashforge.analysis.live
Returns live driving events, trace stats, and analysis sections.
{
  "name": "dashforge.analysis.live",
  "arguments": {}
}
dashforge.command
Runs a controlled DashForge command.
{
  "name": "dashforge.command",
  "arguments": {
    "command": "selectTab",
    "arguments": {
      "tab": "data"
    }
  }
}
Commands
| Command | Arguments | Purpose |
|---|---|---|
toggleUDPListener | none | Toggle UDP listener on/off. |
setUDPListener | enabled | Explicitly enable or disable UDP listener. |
setUDPPort | port | Change UDP listener port and restart if needed. |
setTelemetryProfile | profileID | Switch game telemetry profile. |
setTelemetryUIRefreshRate | hz | Set UI telemetry refresh rate, clamped to 15-60 Hz. |
startReplay | path | Start replay from an absolute .dfrec path. |
stopReplay | none | Stop replay and return to live telemetry. |
setReplayLoop | enabled | Enable or disable replay loop. |
toggleRecording | none | Start recording, or stop and save. |
saveLiveBuffer | none | Save current live buffer as a .dfrec. |
setLiveBuffer | enabled, durationSeconds, maxMegabytes | Configure live buffer. |
setHardwareOutput | enabled, rateHz | Enable/disable hardware output and optionally set rate. |
setPeerDiscovery | enabled, receivingEnabled | Configure LAN peer discovery and transfer receiving. |
setWebBuilder | enabled | Enable/disable Web Builder. |
setPerformanceOverlay | enabled | Show/hide performance overlay. |
sendBridgeCommand | host, port, inputKind, code, mode, durationMs, token | Send game control input through DFBridge. |
resetTelemetry | none | Clear current telemetry and live analysis. |
garbageCollect | none | Clear runtime buffers and request memory collection. |
selectTab | tab | Navigate to dashboard, data, replay, sessions, settings, or about. |
Command Examples
Select the Data tab:
{
  "command": "selectTab",
  "arguments": {
    "tab": "data"
  }
}
Enable UDP on port 8000:
{
  "command": "setUDPPort",
  "arguments": {
    "port": 8000
  }
}
Send a key press through DFBridge:
{
  "command": "sendBridgeCommand",
  "arguments": {
    "host": "127.0.0.1",
    "port": 8765,
    "inputKind": "keyboard",
    "code": "F8",
    "mode": "tap",
    "durationMs": 80
  }
}
Save the live buffer:
{
  "command": "saveLiveBuffer"
}
Security Notes
- Keep the token private.
- Do not expose the port directly to untrusted networks.
- Commands are intentionally limited to app control, telemetry inspection, replay, recording, hardware output, and DFBridge input.
- Receiving analysis data is read-only; mutating commands must use
dashforge.command.