Complete User Tutorial
This tutorial walks through DashForge from first launch to a complete telemetry cockpit.
Use it as a checklist when installing the app on a new machine, preparing a race night, or explaining DashForge to another driver.
What You Will Build
At the end of this guide you will have:
- live telemetry connected to DashForge
- a multi-page dashboard with useful widgets
- replay recording and session analysis ready
- optional network sharing between DashForge devices
- optional hardware output, Bass Shakers, Bridge commands, and AI control
1. Choose Your Telemetry Source
DashForge can receive telemetry in several ways.
| Source | Use it when |
|---|---|
| Game UDP | The game can send UDP packets directly to DashForge |
| DashForge Bridge | The game runs on Windows and exposes shared memory or command control |
| Replay | You want to inspect a saved .dfrec file |
| DashForge Lab | You need synthetic data for development, demos, or testing |
For a first setup, start with game UDP when possible. Use Bridge for Assetto Corsa, ACC, or Windows-only control features.
2. Configure Live UDP
- Open
Settings > Telemetry. - Select the correct game profile.
- Enable the UDP listener.
- Keep the default DashForge port unless your game already uses it.
- In the game, enable telemetry and set the destination IP to the device running DashForge.
The dashboard header should switch from OFF or IDLE to LIVE, and the packet
counter should increase.
If the counter stays at zero:
- confirm the game sends to the correct IP address
- confirm the port matches DashForge
- allow DashForge through the firewall
- keep the computer and console/device on the same local network
- test with DashForge Lab to separate app setup from game setup
See UDP Setup for port, forwarding, and troubleshooting details.
3. Understand The Main Screens
DashForge is organized around daily cockpit tasks.
| Screen | Purpose |
|---|---|
| Dashboard | Drive with live widgets and build cockpit layouts |
| Data | Inspect every telemetry field supported by the current parser |
| Replay | Record, import, delete, and replay raw .dfrec files |
| Sessions | Group recordings, add notes, and run analysis |
| Settings | Configure telemetry, hardware, web builder, AI, store, and diagnostics |
| About | Version, support, credits, and app information |
On iPhone or compact iPad layouts, some destinations may move under More.
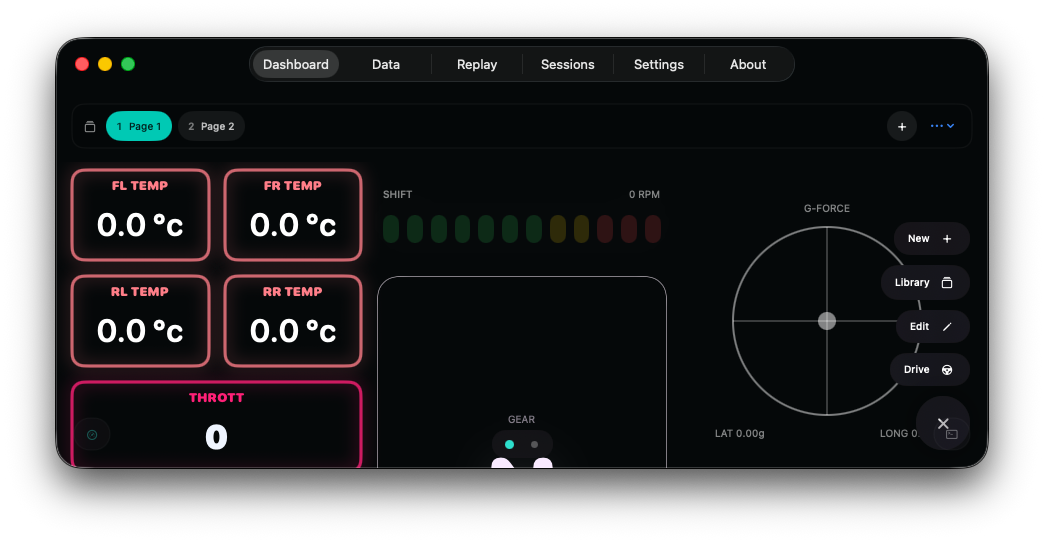
4. Build Your First Dashboard
- Open
Dashboard. - Click
New. - Enter edit mode.
- Add a
Race Dialwidget for speed, gear, RPM, throttle, brake, and steering. - Add
Circuit Infofor lap and position data. - Add
Live Traceif you want the driven path and analysis markers. - Save the dashboard.
DashForge dashboards use grid placement. Widgets can be moved, resized, duplicated, removed, and customized. In 1.1.0 dashboards can also contain multiple pages.
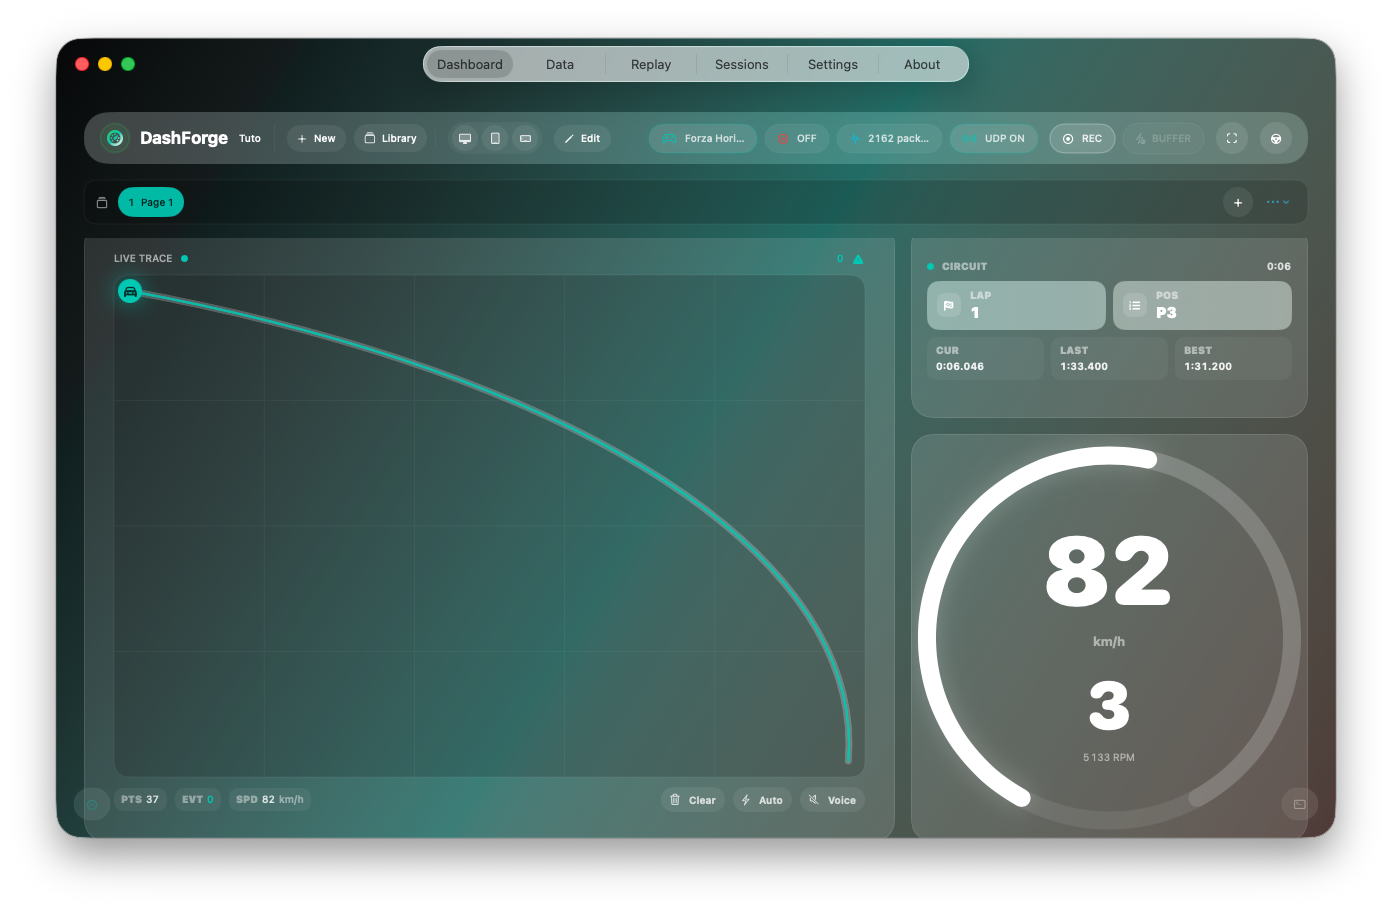
5. Use Multiple Dashboard Pages
Pages let you separate driving views instead of overcrowding a single screen.
Recommended layout:
| Page | Suggested content |
|---|---|
| Page 1 | Race Control, lap info, fuel or battery |
| Page 2 | Live Trace, analysis widgets, tyre and drift data |
| Page 3 | Hardware controls, action buttons, diagnostics |
In edit mode you can add, rename, delete, and switch pages. In drive mode, page controls stay out of the way so the cockpit remains clean.
6. Pick Widgets That Match The Car
Use only widgets that make sense for the current game and vehicle.
| Widget | Best for |
|---|---|
| Race Control | General racing, speed, RPM, gear, inputs |
| Analog Race Control | Custom speed/RPM gauges with needle styling |
| Fuel Status | Combustion cars and stint planning |
| Battery Status | EV, hybrid, ERS, or energy store telemetry |
| Circuit Info | Lap time, position, current/last/best |
| Live Trace | Track path, live events, lockups, mistakes |
| Drift Tyre HUD | Drift angle, rear tyre stress, grip state |
| Action Button | Trigger Bridge/game/hardware commands |
| Stickers | Decoration, labels, logos, layout cues |
For fuel and battery widgets, choose the display mode that fits the available space: full, minimal, horizontal bar, or vertical bar.
The complete catalog is documented in the Widget Reference.
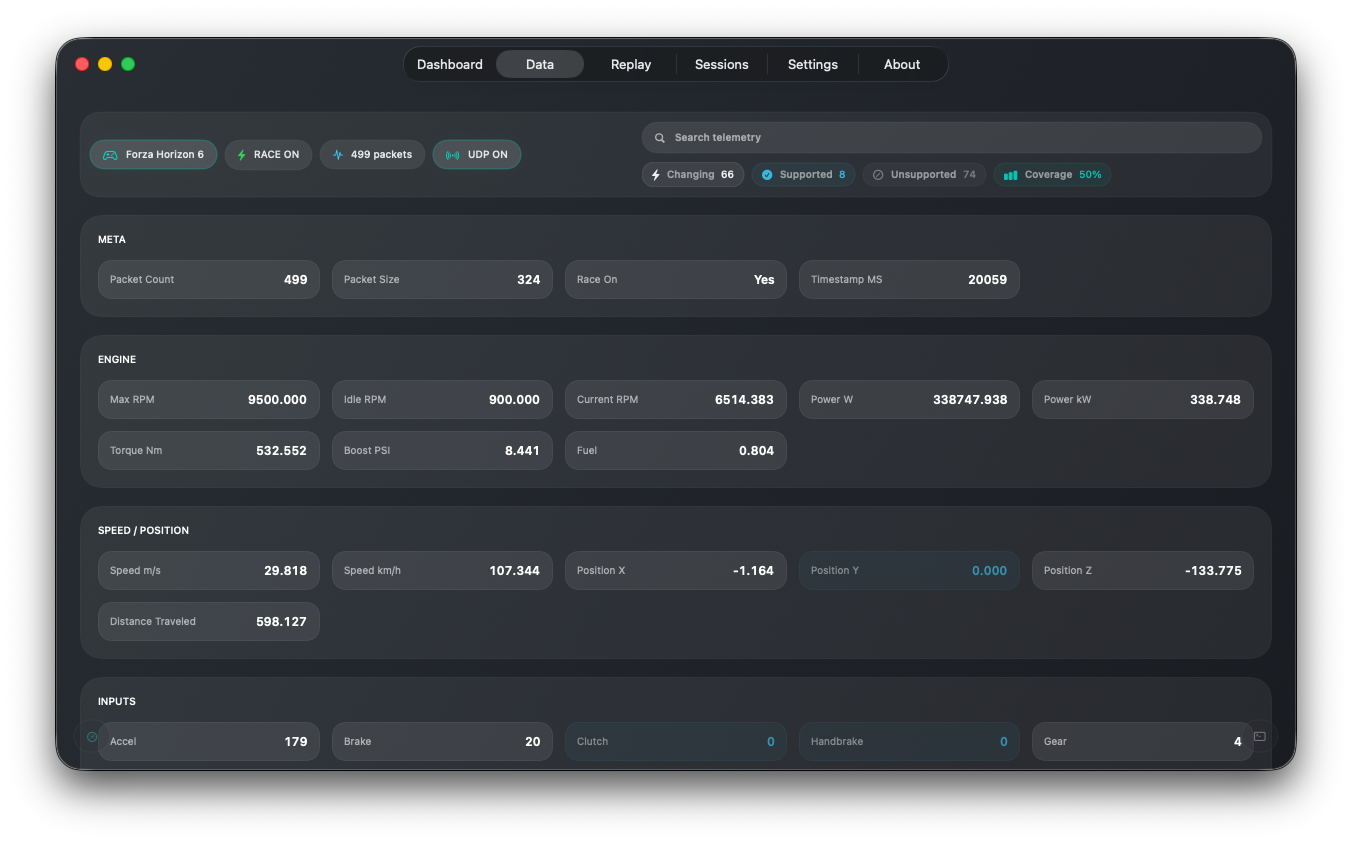
7. Use The Data Explorer
Open Data when a widget looks wrong or a parser needs checking.
Use it to:
- search fields by name
- see which values are changing
- compare supported and unsupported fields
- confirm whether a game exposes fuel, battery, tyre, suspension, or lap data
If a widget shows 0 or --, first check whether the field exists in Data Explorer.
Some games simply do not expose every telemetry value.
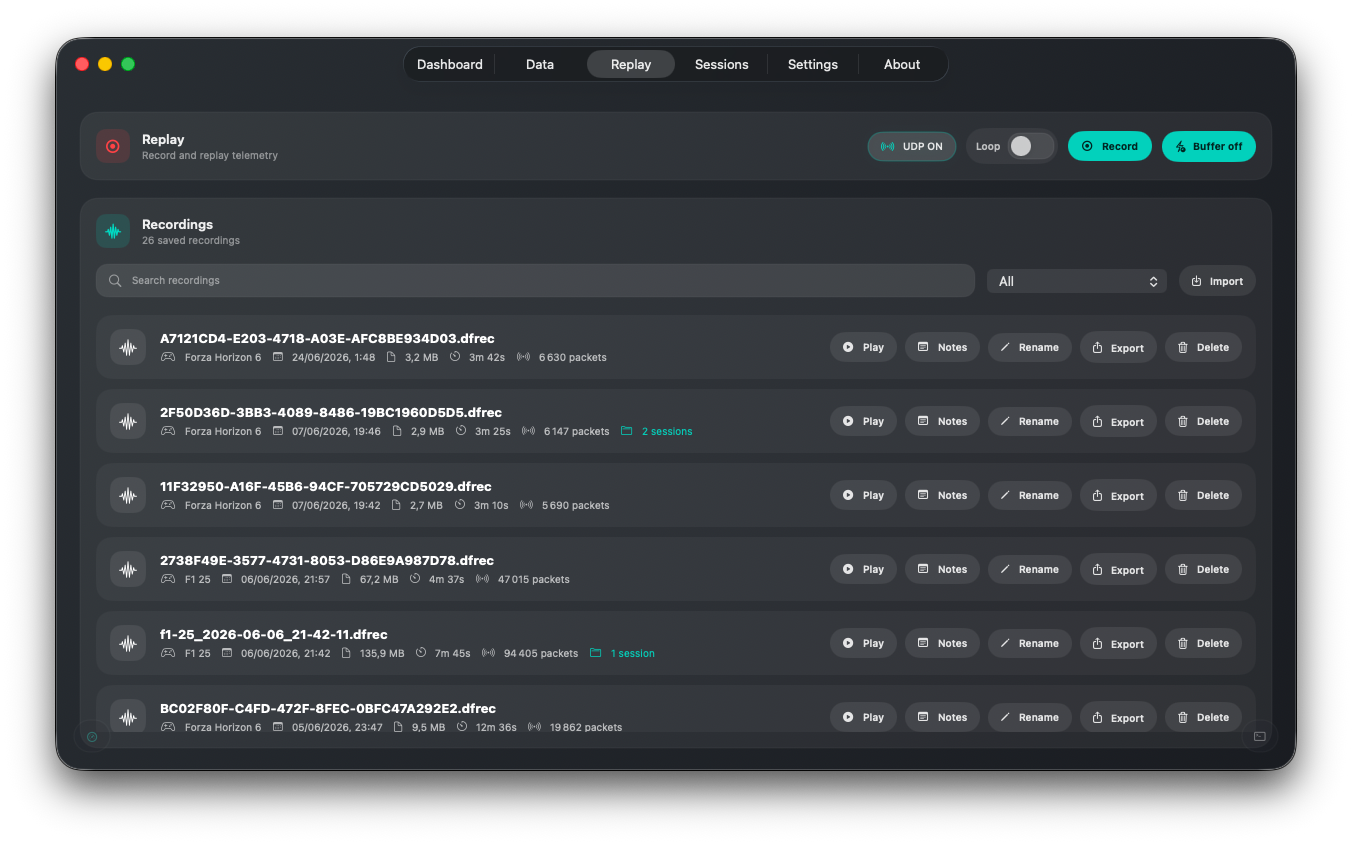
8. Record And Replay Telemetry
Open Replay to manage .dfrec recordings.
Basic workflow:
- Start live telemetry.
- Press
REC. - Drive a lap or session.
- Stop recording.
- Rename and annotate the recording.
- Replay it later without the game running.
Replay uses the parser stored in the recording, so old recordings remain usable even if another live profile is currently selected.
The recording list keeps its cached content visible while DashForge refreshes metadata in the background.
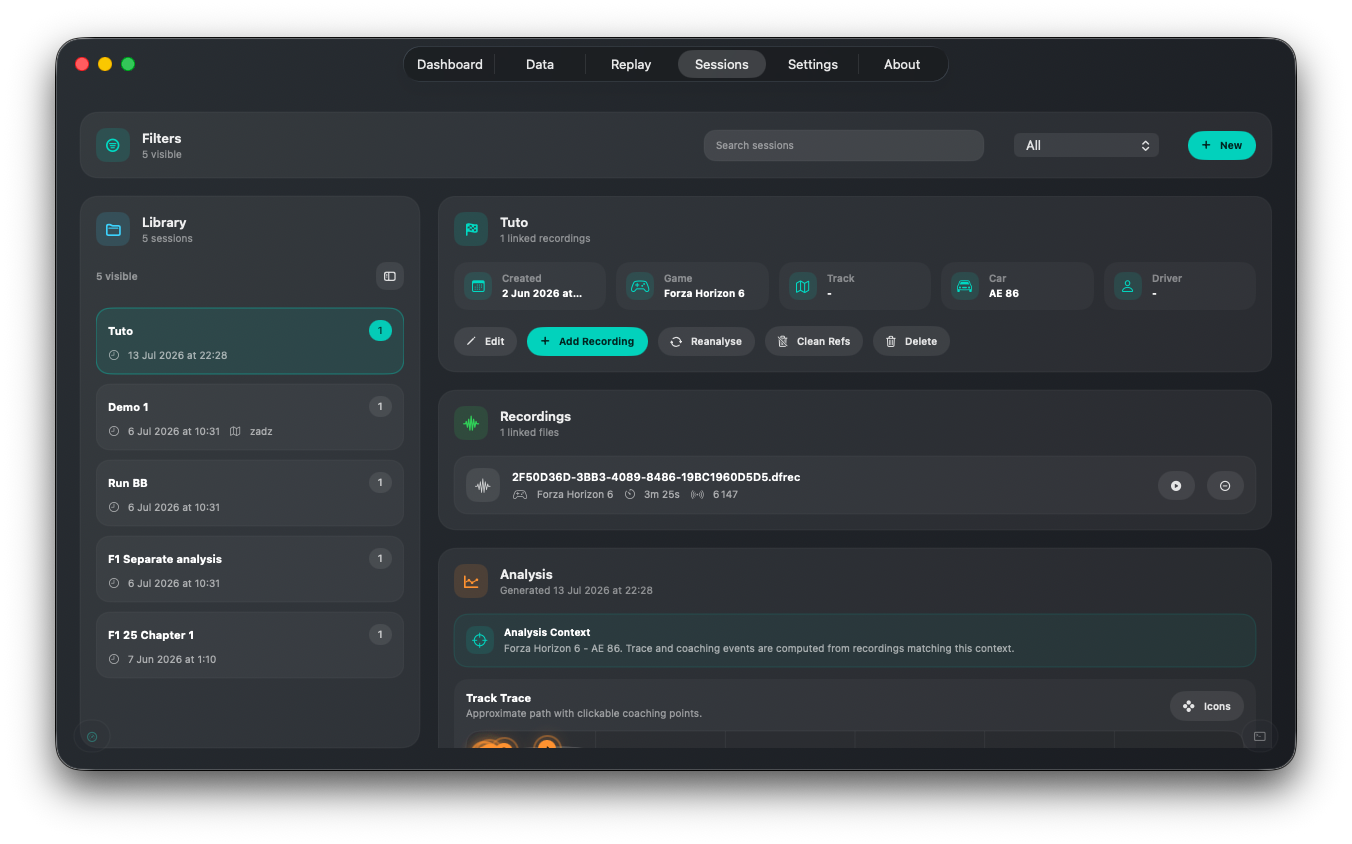
9. Create A Session And Run Analysis
Sessions turn raw recordings into useful driving review.
- Open
Sessions. - Create a session.
- Add one or more recordings.
- Add notes, tags, and context.
- Run
Analyze.
Analysis can generate:
- track trace
- driving sections
- braking and lockup events
- drift and traction events
- speed and input samples
- severity, timestamp, and advice
When analysis is running, DashForge shows progress instead of freezing the screen. Cached results are saved in the session.
10. Share Dashboards, Recordings, And Sessions
DashForge can discover other DashForge apps on the local network.
Before sharing:
- Open
Settings > Telemetry > Network Sharing. - Enable discovery.
- Enable receiving on the target device.
- Use
Force Scanif peers do not appear immediately.
You can send:
- dashboards
- recordings
- complete session packages with linked
.dfrecfiles
Receiving is protected. The target device sees a confirmation prompt before the payload is downloaded, then an import progress state during transfer.
See Network Discovery and Sharing.
11. Edit From A Browser With Web Builder
The Web Builder lets another device on the local network edit dashboards in a browser.
Use it when:
- the cockpit display is mounted away from the keyboard
- you want to edit from an iPad or laptop
- you need faster layout iteration
In Settings > Web, enable the Web Builder server, copy the local URL, and open it
from another browser on the same network. Use the access token shown by DashForge.
The web editor supports dashboard selection, pages, widget add/remove/duplicate, dragging, resizing, and widget configuration.
12. Control Games With Action Buttons And Bridge
Action Button widgets can trigger commands through DashForge Bridge.
Common uses:
- pit limiter
- headlights
- wipers
- camera changes
- replay controls
- custom keyboard shortcuts
- Windows messages
To make the dashboard feel like a button box, edit the Action Button widget and choose a Skin:
Push Buttonfor momentary actionsOn / Offfor clear toggle-style controlsStart Enginefor ignition/start commandsRockerfor up/down or two-state switchesToggle Leverfor a more physical switch look
Use Label placement when building dense panels so labels align consistently above, below, left, or right of each control.
Bridge supports multiple input strategies depending on the game:
| Mode | Use it when |
|---|---|
| Keyboard | The game accepts keyboard shortcuts |
| Mouse | You need click or pointer actions |
| Win32 | A game or tool accepts Windows message control |
| Gamepad | Requires a virtual gamepad driver such as ViGEm |
See Game Control and DashForge Bridge.
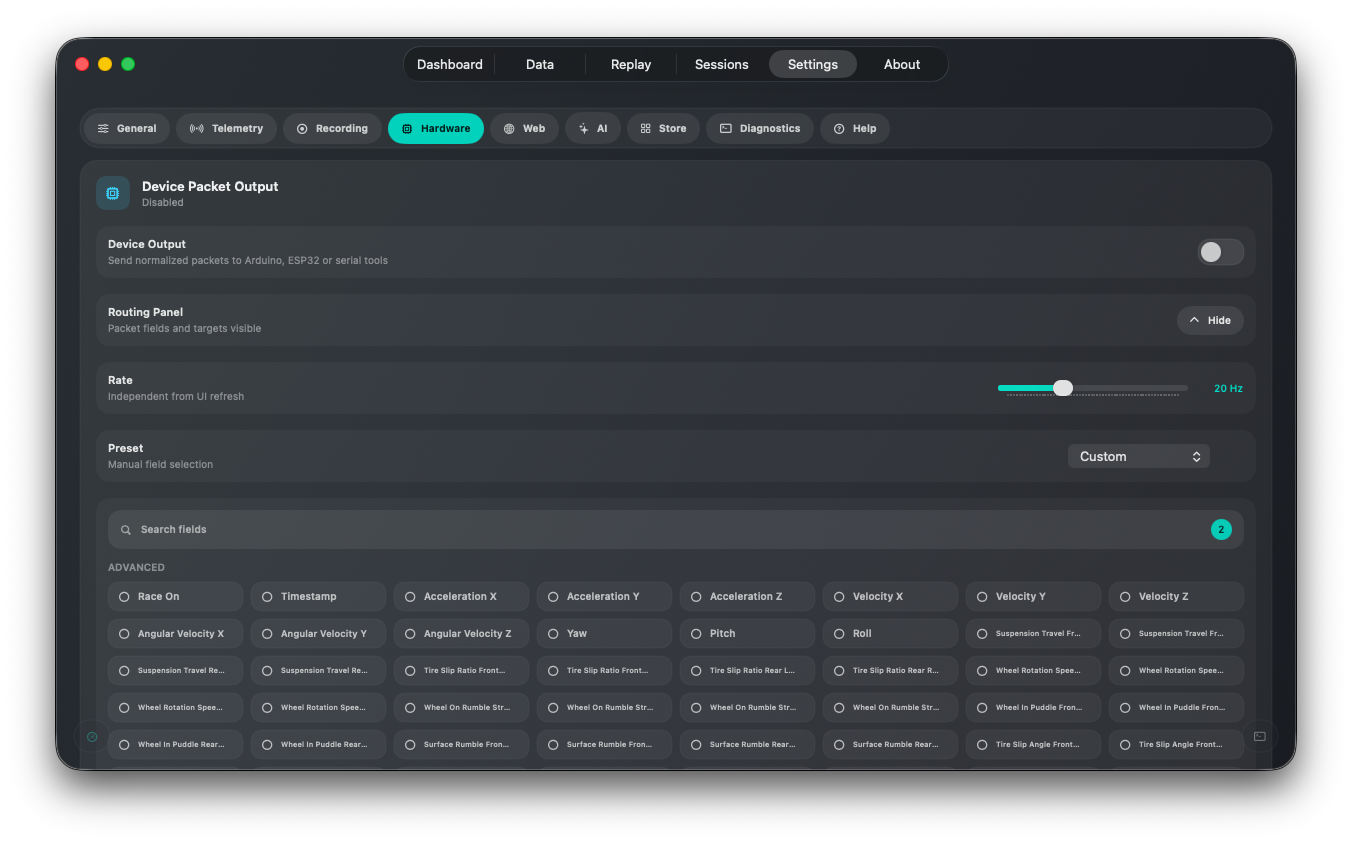
13. Output Telemetry To Devices
Open Settings > Hardware for physical cockpit integrations.
Device Packet Output can send selected telemetry fields to:
- Arduino
- ESP32
- serial tools
- UDP receivers
- shift lights
- gear displays
Choose exactly which fields are included in the packet to keep the output small and
fast. Use a lower output rate for simple hardware and a higher rate for responsive LEDs.
s
14. Configure Bass Shakers
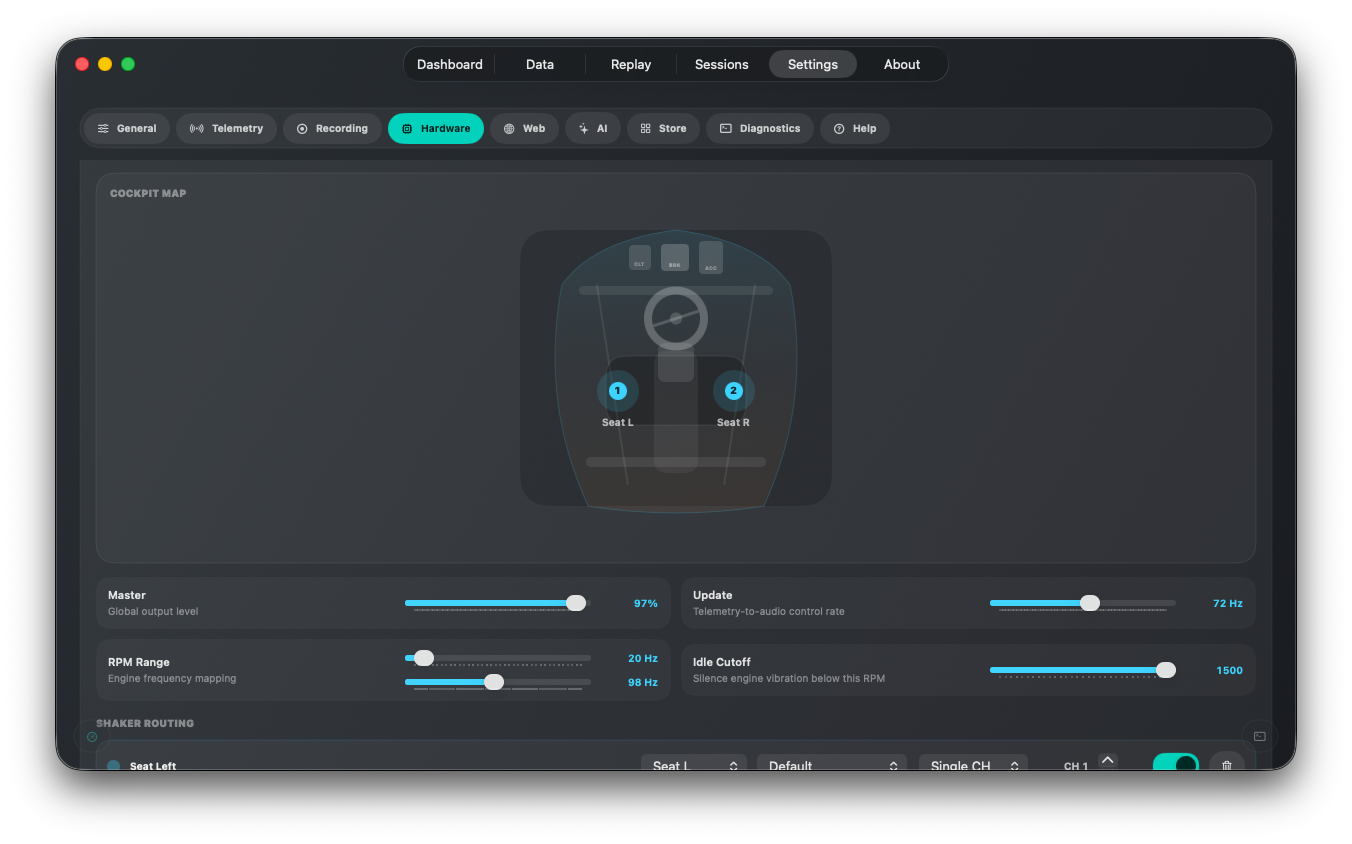
Bass Shakers generate low-frequency audio from telemetry.
You can:
- assign shakers to seat, rear, pedals, brake, clutch, accelerator, and other zones
- choose an audio output per shaker
- select channel routing
- control engine, road, suspension, slip, brake lock, and gear shift effects
- visualize shaker placement on the cockpit map
Start simple: one shaker under the seat, engine and road effects around 40-50%, then add more zones once the baseline feels right.
15. Configure Wind Simulator
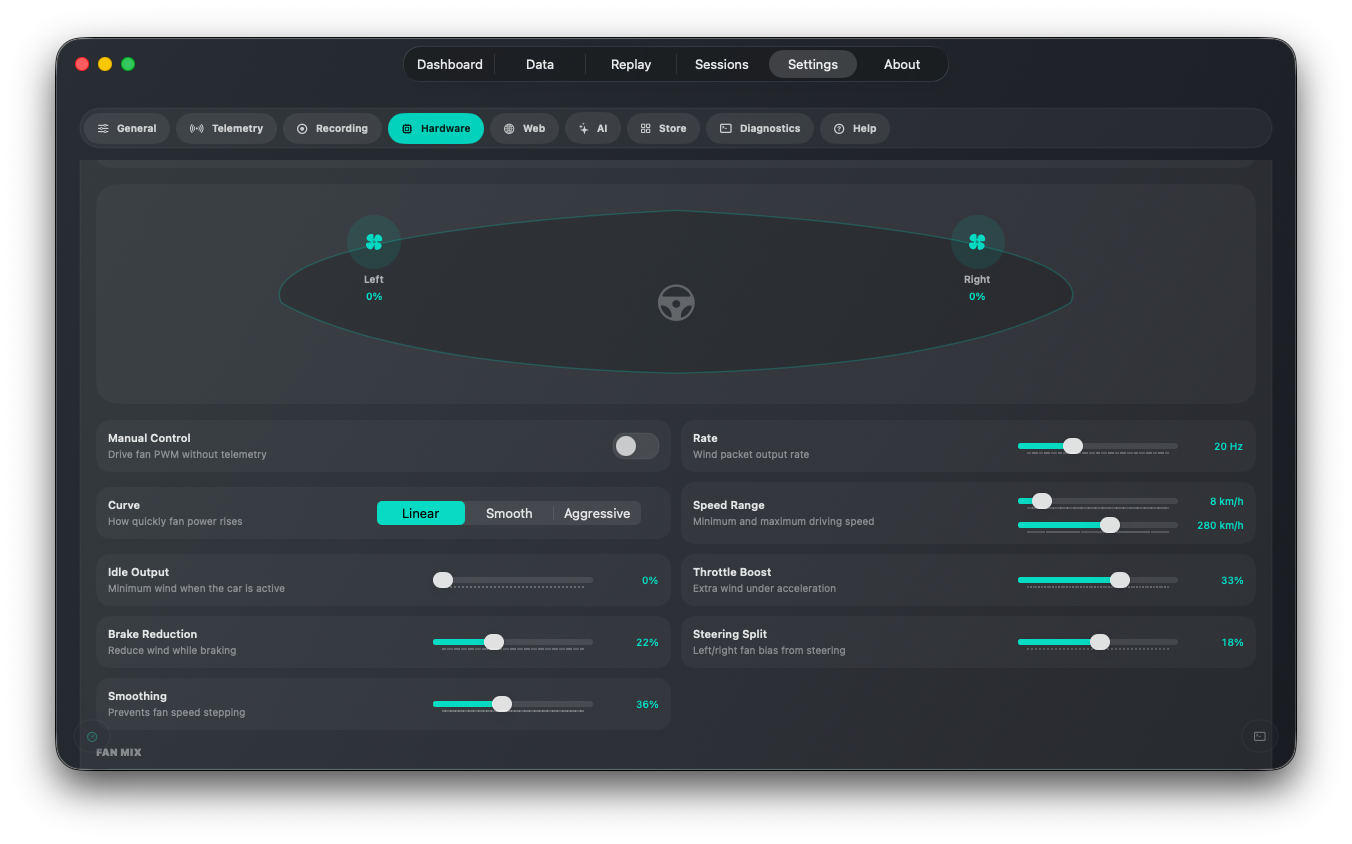
Wind Simulator generates fan levels from speed, throttle, brake, and steering.
You can:
- add left, right, or center fans
- tune speed range and response curve
- add throttle boost and braking reduction
- split airflow left/right from steering
- output JSON packets over UDP or Serial
Start simple: two fans, one Left and one Right, Smooth curve, 20 Hz, and a
UDP target. Use Test Wind before connecting real hardware.
See Wind Simulator.
16. Use DashForge Lab For Testing
DashForge Lab is an internal simulator for development and demos.
Use it to:
- generate telemetry without launching a game
- replay
.dfrecfiles into DashForge - test hardware output
- test Bridge commands
- simulate a car with keyboard, mouse, or controller input
- send data using supported game formats
See DashForge Lab.
17. Control DashForge With AI
DashForge includes a local MCP-compatible service for AI tools.
Use it to:
- inspect app status
- list available commands
- query telemetry state
- request session analysis summaries
- trigger supported DashForge actions
Enable it only on trusted machines and networks. See MCP AI Control for setup and LM Studio configuration.
18. Performance Checklist
If the app feels slow:
- Open the floating performance panel.
- Check FPS, UI Hz, UDP PPS, replay PPS, CPU, memory, RSS, and network rate.
- Lower UI refresh rate before lowering game telemetry rate.
- Hide heavy debug panels while driving.
- Keep Live Trace and analysis widgets only where useful.
- Disable debug logging during long replays.
- Use
GCfrom the performance panel after heavy imports or long debug sessions.
High UDP packet rate alone should not force 100% CPU. If CPU spikes, check logging, forwarding loops, oversized dashboards, and hardware output rates.
19. Backup And Update Safely
Before major changes:
- export important dashboards
- export session packages, not only session documents
- keep
.dfrecrecordings with their sessions - backup custom game profiles
- note hardware output settings
After updating DashForge, open What's New and test one live profile, one replay, and
one dashboard before a competitive session.
Quick Setup Checklist
- Install DashForge.
- Pick the game profile.
- Enable UDP or Bridge.
- Confirm packet count increases.
- Build or import a dashboard.
- Save the dashboard.
- Record a short
.dfrec. - Replay it.
- Create a session and run analysis.
- Optional: enable sharing, Web Builder, hardware output, Bass Shakers, Wind Simulator, or MCP.